Setup and Configuration: Part 1
Create Multiple Views of your GA Data
Google Analytics is organized into Organizations, Accounts, Properties and Views. The relationship among these is hierarchical:
- An Organization typically represents a company, which might use multiple Google products (for instance, Google Analytics, Google Tag Manager, Google Optimize). At the Organization level, you might manage your analytics users, permissions and integrations between the different Google products.
- An Account is an umbrella structure for one or more properties – digital products (websites, apps, etc.) – tracked with Google Analytics.
- A Property is a website, mobile application or other device (for instance, a kiosk) that Google Analytics is collecting data for. Each property has a unique Google Analytics ID (something like UA-000000-2).
- A View is a single way of structuring and seeing data for a particular property. Once you create a view, the reports for that view will show data from the date of creation onward.
More information about this hierarchy can be found at https://support.google.com/analytics/answer/1009618?hl=en

An example showing Accounts, Properties & Apps and multiple views for one Property
By default, Google Analytics creates a single View of your website’s data – showing analytics for all users from the day you created it. But you can – and should! – create multiple views of your data. You’ll typically do this by either “filtering” the data (showing only traffic meeting certain conditions) or by “segmenting” the data (displaying analytics for different subsets of your audience).
Here’s a list of Views you should create, in descending order of importance:
- All users, unsegmented and unfiltered: This View will be created automatically when you first put the GA code on your page templates and start generating analytics data.
- A primary view: This is the one you’ll use most often for day-to-day analysis and asking questions. Set up the segments and filters you want to use (more on segments and filters below), then create additional Views by copying the primary view. (Copying is an option under View Settings.)
- A “test” view: In this View you can experiment with different configurations and filters without affecting the unfiltered data. It’s useful because you can’t recover analytics data once Google Analytics processes it and creates reports. The test View allows you to make sure that your filters and configurations are working the way you want them to – before you apply them to the View(s) that you work with regularly.
- Views based on a specific audience source: For instance, if your website depends heavily on traffic from search engines, or from social media, you might want a separate View for these users. This will enable you to drill deeply into information about their behavior whenever you want to do so.
- A view just for annotations: Annotations (see below) are a very useful way to insert reminders or explanations about specific things you find for certain dates in the Google Analytics data. (For instance, you could insert an explanation for a traffic spike on a certain day.) By putting annotations into a separate View, you avoid cluttering up the main screen of your primary view.
- Examples of other Views: If there are particular reports you use a lot, or ways you want to look at your data regularly, you may want to create separate Views rather than have to navigate to those reports each time. For instance:
- Only traffic from a particular geographic area: If your primary target audience is within a certain country, state or city, you can look at those users’ behavior only.
- Only mobile traffic: If you rely primarily on mobile users, this view will let you look at them separately from everyone else.
- Only social media traffic (or even, say, only Facebook traffic): If you want quick access to information about users being sent to your website via social media, this will let you see data about only those users.
Exclude Traffic from Known Bots/Spiders
By default, Google Analytics counts traffic coming from search engine crawlers and other automated “bots” and “spiders.” You want to exclude this traffic because it does not reflect human usage of your site.
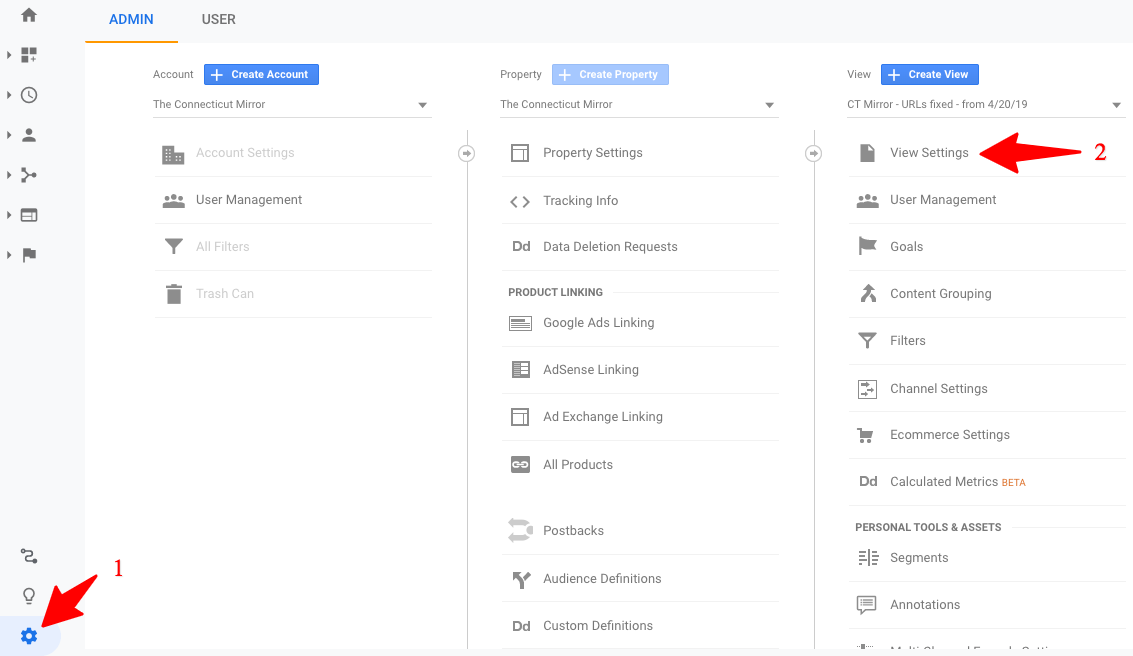
- Click the “Admin” icon in the lower left
- Click on “View Settings” under your primary View

- Change “Select Filter Type” to “Exclude”
- Set “Filter Field” to IP address.
- Under “Filter Pattern,” enter the IP addresses for your internal network. (Go here to find out your IP address or ask your internet provider or IT staff.)
5. Click "save".
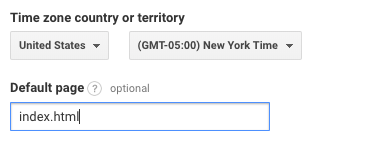
Set the “Default Page” for your Website
Web servers have a default HTML page name that is displayed automatically when a user clicks on a ‘s that ends in a folder (directory) name. Typically, that page is called “index.html” or “index.htm.” For instance, these two URLs will display the same page in a browser:
If you don’t tell Google Analytics that these URLs both display the same page, visits to those two URLs will count pageviews separately, as if they were different pages.
To fix this, set the default page for your website as index.html.
- Click the “Admin” icon in the lower left
- Click on “View Settings” under your primary View
|
 |
Exclude Query Parameters When Identifying Unique Pages
A variety of publisher tools – for instance, those used for social media posting – automatically add a “query parameter” to the URL.
For instance, a link from Facebook might include the query parameter “?fbclid.” A link shared using Sprinklr, a social media management tool, will include the query parameter “?linkID”
This creates a situation, for instance, where traffic to these two pages are counted separately:
- https://www.websitename.com/news/council.html
- https://www.websitename.com/news/council.html?linkId=58938154
You’d probably like those pageviews to be consolidated and counted as the same page. Here’s how to do that:
- Click the “Admin” icon in the lower left
- Click on “View Settings” under your primary View
| 3. In the box for “Exclude URL Query Parameters,” enter the parameters you want Google Analytics to ignore, separated with commas.
4. Click “Save” at the bottom of the window. |
 |
Connect Google Analytics with Google Search Console
Google Search Console, a separate tool from Google Analytics, provides website managers with insights into their search traffic: especially, what keywords are driving traffic to your site and what pages are getting that traffic.
That information will be more easily accessible if you connect Google Analytics with the Search Console. Here’s how:
First, if you haven’t already done this, set up Google Search Console and verify ownership of the website. Instructions for doing this can be found at https://support.google.com/webmasters/answer/34592?hl=en
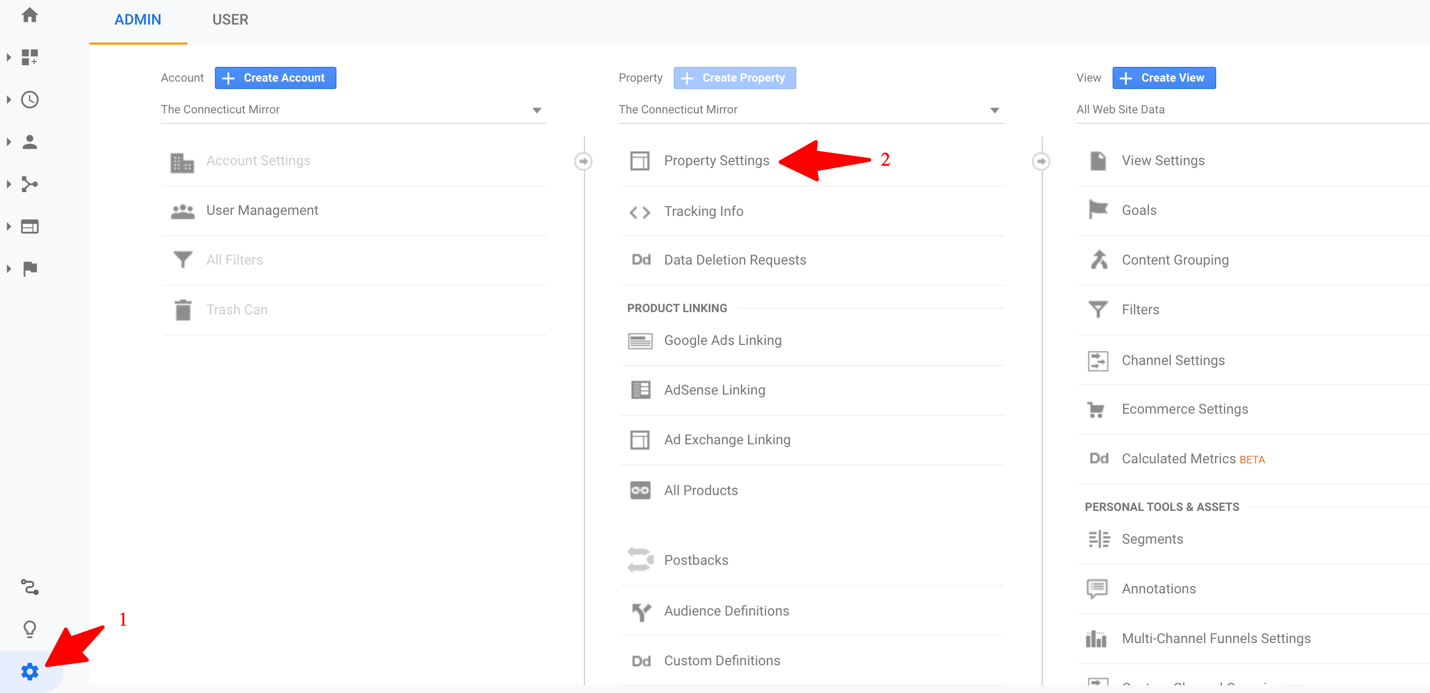
- Click the “Admin” icon in the lower left
- Click on “Property Settings” for your Property
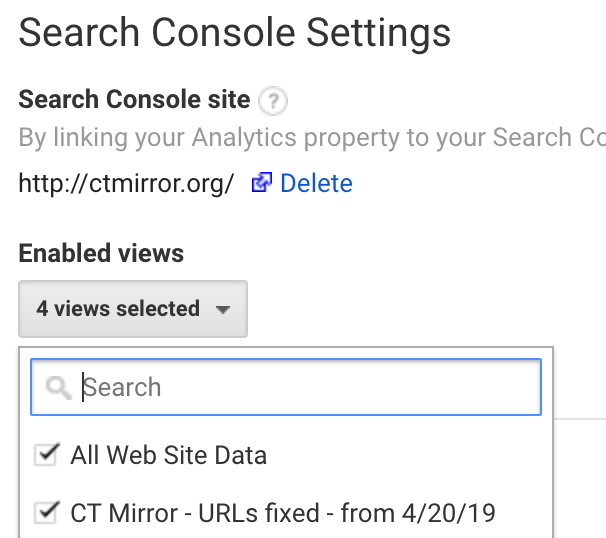
- In the Search Console Settings section, click the “Adjust Search Console” button.
- Check the View or Views in which you want to be able to see the Search Console data.
- Click “Save” at the bottom of the window.
|
|
Once you have done this, you’ll be able to access information about search keywords and landing pages through the Acquisition > Search Console menu.
You can learn more about Google Analytics and Google Search Console integration from this article: https://support.google.com/webmasters/answer/1120006?hl=en
Set up the Site Search Report
Most likely, your site has a search function – a form on the page where users can search the content of your site. Knowing what users are searching for can be very valuable information – it will tell you what content users expect you to provide and, perhaps, help you identify content areas you should focus on more.
With one simple configuration step, you can have Google Analytics generate reports on what users are searching for on your site.
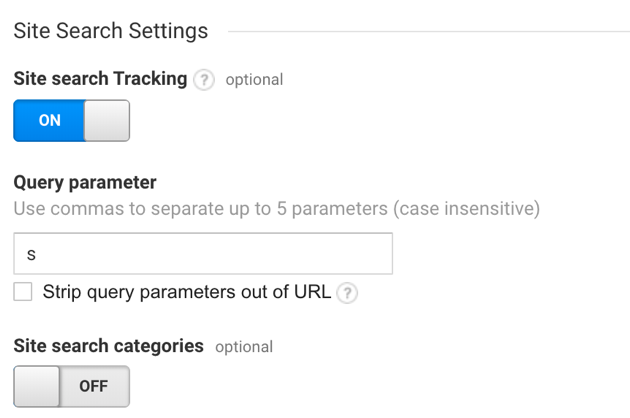
First, figure out what your website uses as the “query parameter” for site search. Type a term into the search window and press “Enter.” In the URL that appears, you should see a character or string of characters between a question mark and an equal sign. In the example below from the Connecticut Mirror, you can see that the search query parameter is the letter s.
To set up the Site Search report in Google Analytics:
- Click the “Admin” icon in the lower left
- Click on “View Settings” under your primary View
|
 |
You’ll see the search terms people are using on your site under Behavior > Site Search. But this data will be compiled only once you set this up, so you won’t see much value for at least a few weeks or months.
More information about setting up the Site Search report can be found at https://support.google.com/analytics/answer/1012264?hl=en
Enable demographic/interests reporting
If you are willing to share information about your users with Google for its ad-targeting services, Google will in return provide you with information about your users’ demographics and interests. This can be useful to you in understanding your audience better.
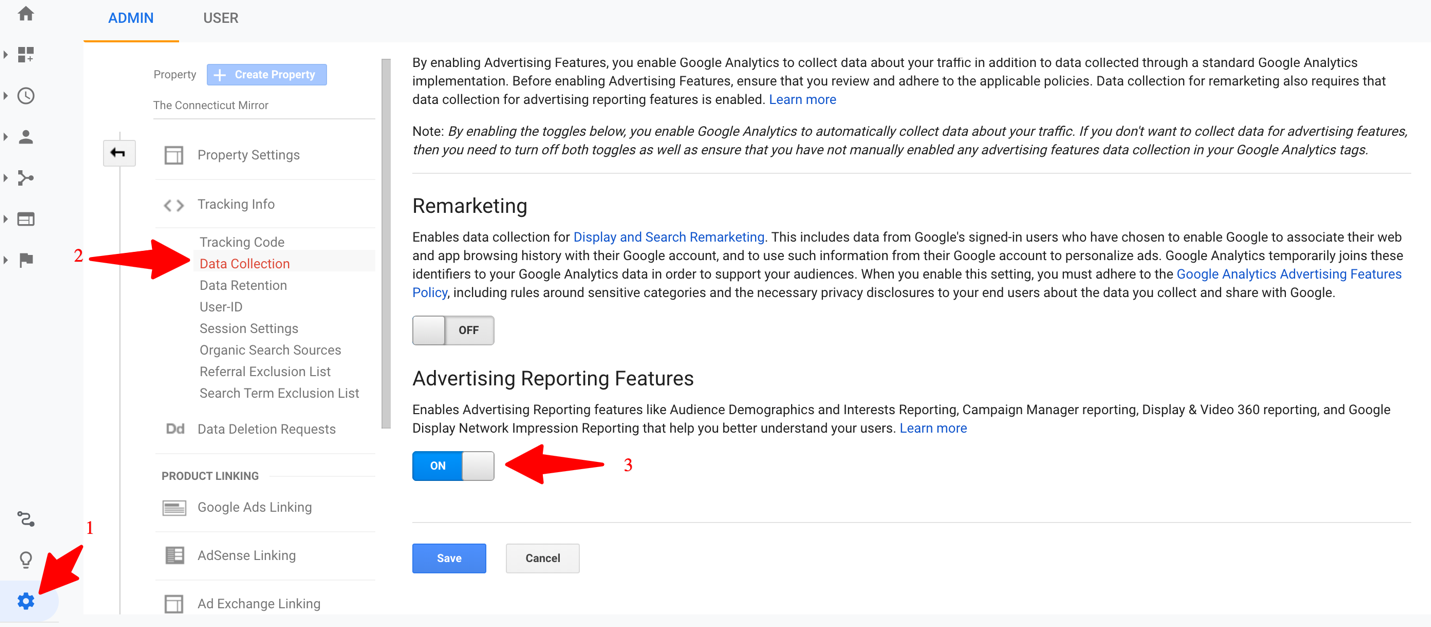
To enable these reports, there are two steps. First, enable Advertising Reporting Features:
- Click the “Admin” icon in the lower left
- Click on “Tracking Info” and then “Data Collection”
- Slide the “Advertising Reporting Features” toggle to “ON.”
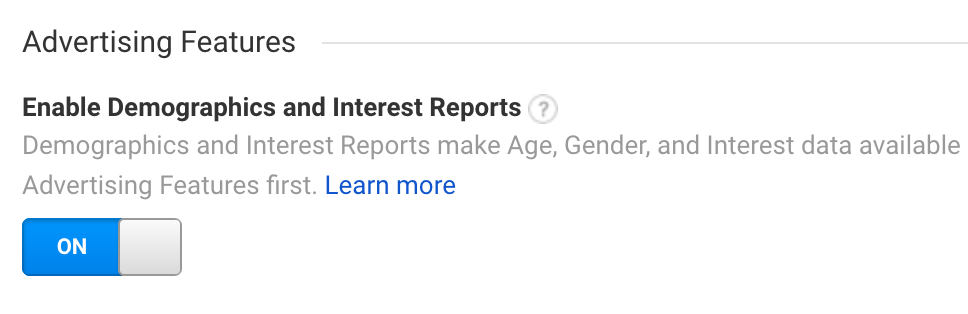
Now that you’ve enabled Advertising Reporting Features, you need to tell Google Analytics that you’d like to see information about your site’s audience:
- Click the “Admin” icon in the lower left
- Click on “Property Settings” for your Property

|
 |
You’ll be able to access information about your users’ demographics and interests under the Audience menu (Audience > Demographics and Audience > Interests).