Setup and Configuration: Part 2
Google Analytics in Operation
Use annotations to mark interesting things you observe on the site
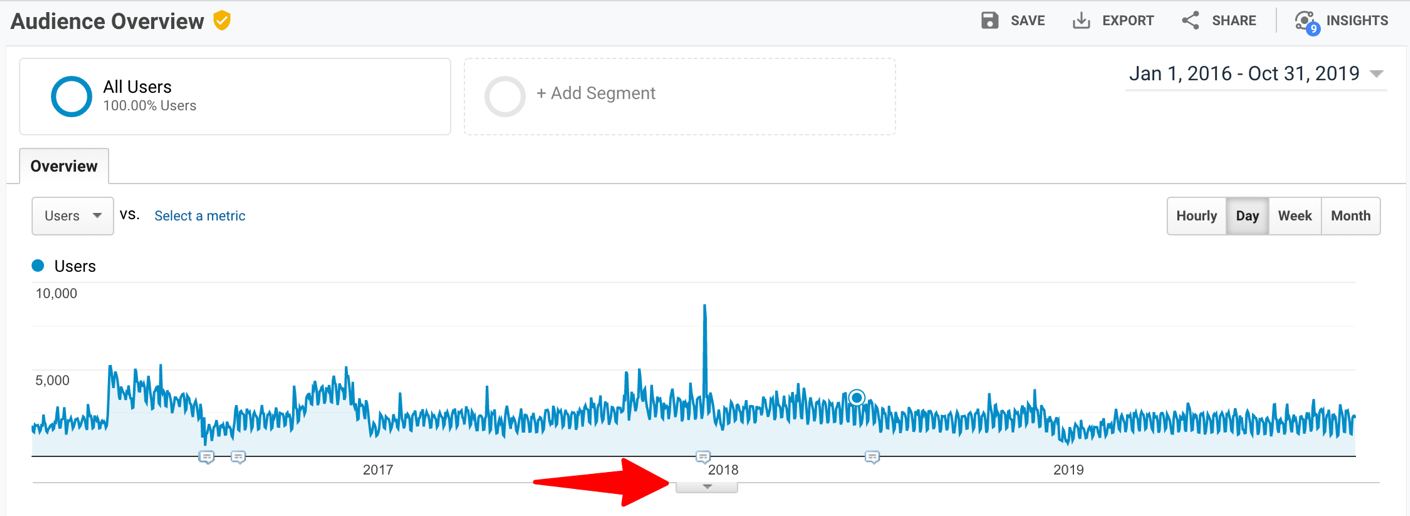
One of the most useful tools in Google Analytics is the Annotation tool. Here your authorized Google Analytics users can mark explanations for things that have an impact on your data. For instance, a spike in traffic or a configuration change.
To create an annotation, start by clicking the little down arrow below the timeline.
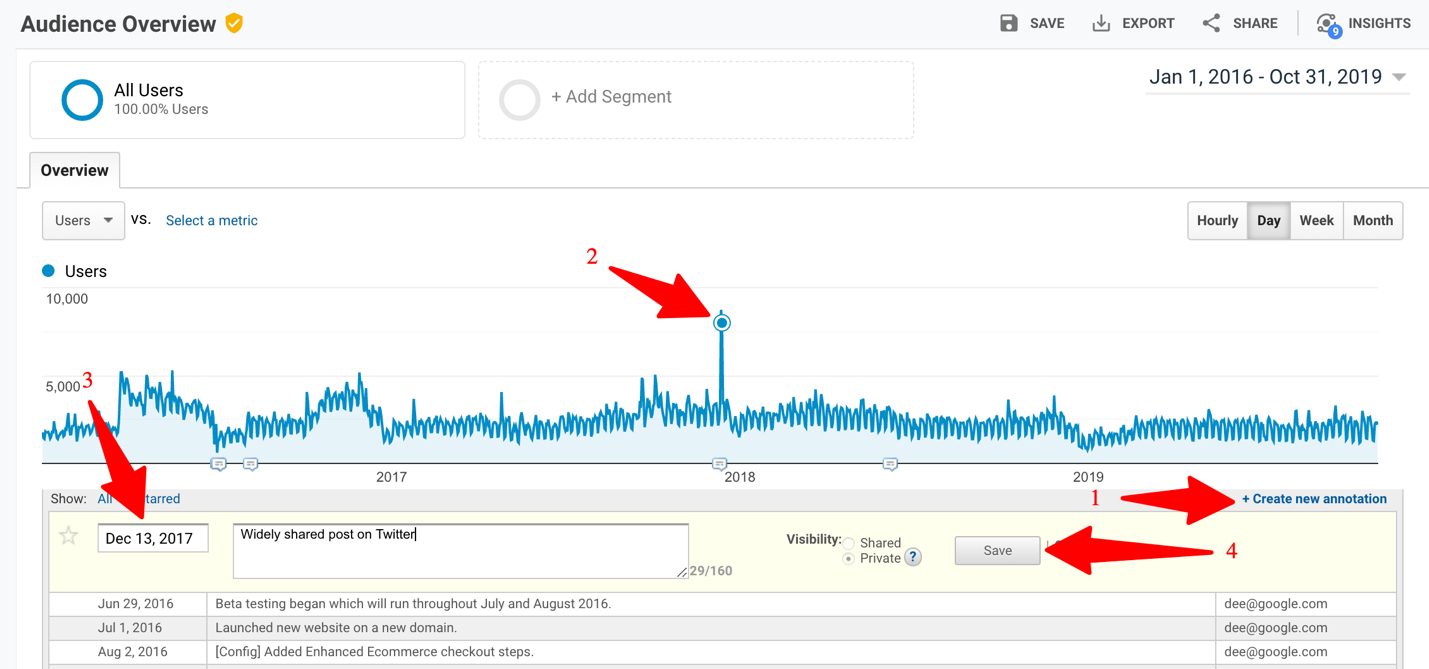
Then follow these steps:
- Click the blue “+ Create new annotation” area and add your annotation.
- Click on the point on the timeline that you want to annotate
- Enter the date for that annotation, and an explanation
- Click the “Save” button.
Watch out for sudden drops in bounce rate
It’s a good idea to look at your key metrics regularly. One surprising issue you may discover is a sudden decline in the site’s bounce rate. For instance, in the example below, the bounce rate drops suddenly in June 2017.
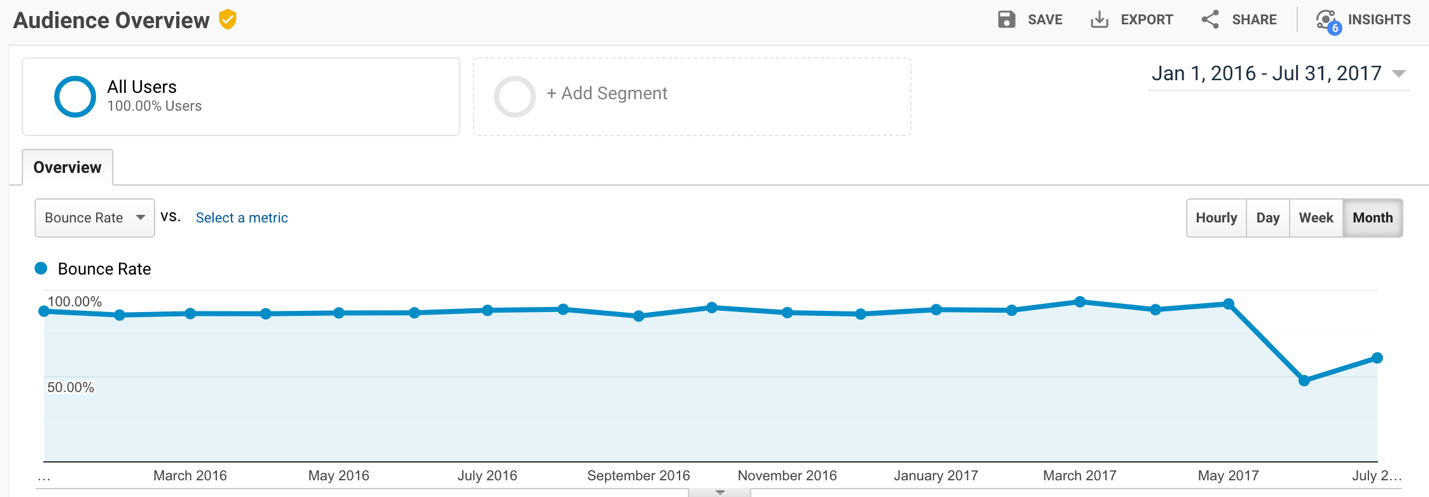
You’ll be tempted to think this is a good thing – people are now more likely to view more than one page on a visit! – but it’s almost always due to a mistake in placing the Google Analytics code on your site’s page templates. Usually it means that new Google Analytics code has been added to a template that also includes another string of Google Analytics code. This means that each view of the page is causing Google Analytics to count two separate pageviews. So you’re inflating the number of pages viewed, and reducing the bounce rate (the percentage of visits in which only one page was viewed).
If you see a sudden drop in the bounce rate, take another look at the HTML code on your page templates and see if someone has inadvertently placed two separate GA snippets on that page.