Setup and Configuration: Part 3
Segmenting your audience based on visit frequency
For today’s news and information websites, one of the greatest challenges is increasing users’ engagement levels. Many users visit the site infrequently, perhaps just following a social media link. Others may come occasionally. But the most valuable users visit regularly and habitually. You can use Google Analytics to segment your audience based on frequency of visits. This will enable you to quantify how many users come with different frequencies – and to understand differences in behavior among those audience segments.
One important caveat: Google Analytics doesn’t track individual users; its tracking is based on cookies, which are associated with browsers. So an audience segmentation based on frequency of visits will really be counting different browsers rather than people. But for purposes of understanding the differences between users based on frequency of visits, this kind of segmentation can be useful.
This approach has been used by the Center for Cooperative Media at Montclair State University in New Jersey to create an “Audience Explorer” dashboard. Their tool uses Google Data Studio to set up a report that can be updated monthly based on three audience segments:
- Casual Visitors: 1 session per month
- Prospective Loyalists: 2-5 sessions per month
- Brand Lovers: 6 or more sessions per month
For more information on the Center for Cooperative Media’s tool, visit https://medium.com/centerforcooperativemedia/introducing-the-audience-explorer-dashboard-for-small-publishers-9fbff748c47
As noted in that article, these reports can be “painfully slow” to generate. They’ll be valuable to you only if someone on your staff has time to configure them and make regular use of them.
As an introduction to what’s possible via segmentation, here’s how to generate overall data for these three audience segments in a single Google Analytics View.
Create a new View for these segments. This will make it possible for you to look at the data any time you want, without changing your other Views. You might call this View “Users by session frequency.”
Then follow these steps:
- Navigate to Audience > Overview.
- Above the timeline, click on the “+ Add Segment” button. The button text will change to “Choose segment from list.” Below you’ll see a red “+NEW SEGMENT” button and a list of pre-loaded segments will display.
- Click on “+NEW SEGMENT.”

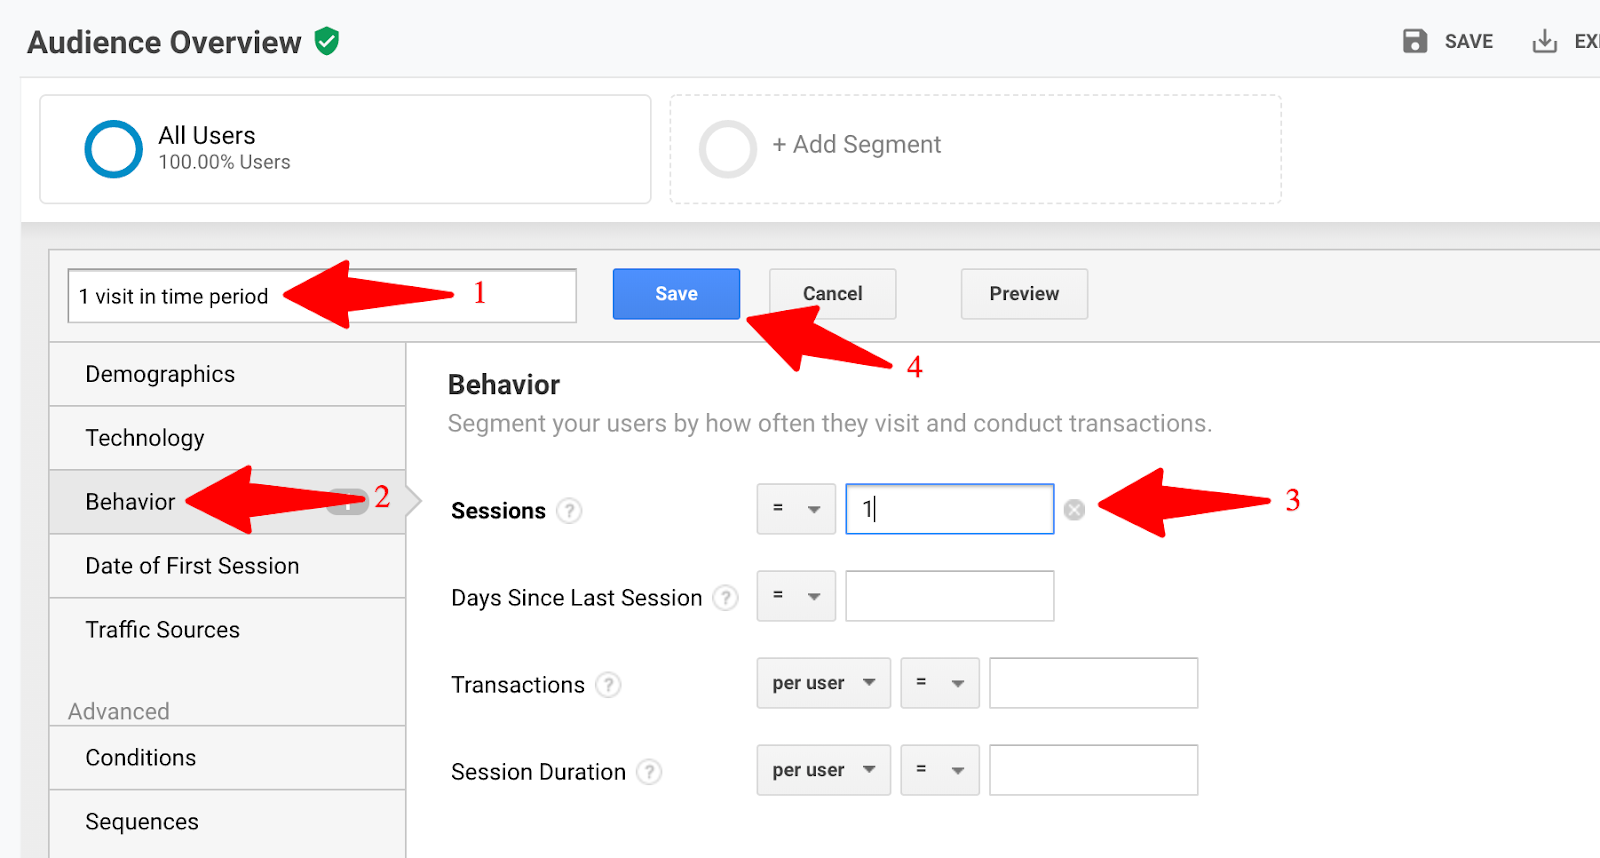
Create your first segment, for those visiting just once in a given time period:
- Give your segment a name; for instance, “1 visit in time period.”
- Click “Behavior” in the list of segmentation categories.
- Set the number of sessions as =1
- Click the blue “Save” button.
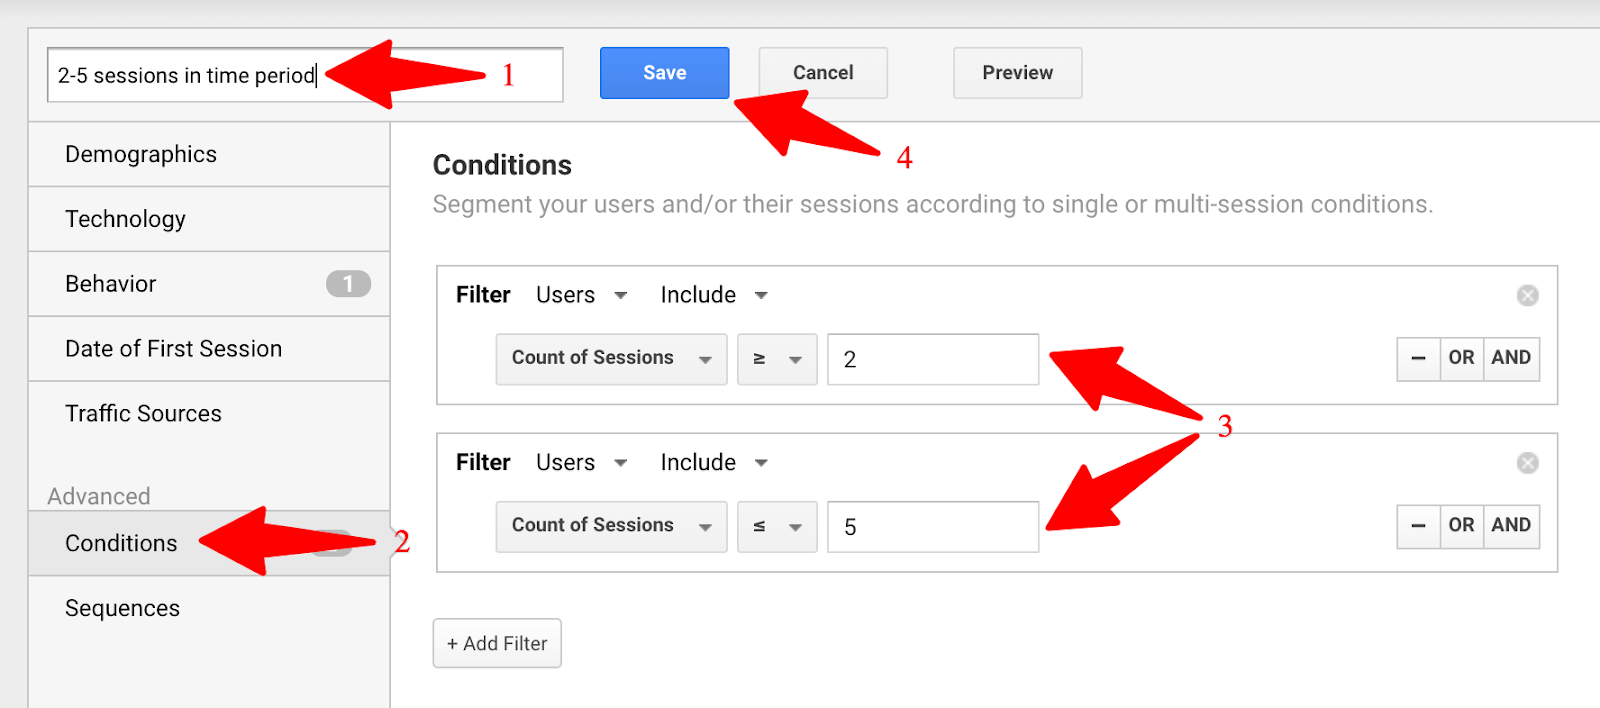
Create your second segment, for those visiting 2-5 times in a given time period:
- Give your segment a name; for instance, “2-5 visits in time period.”
- Click “Conditions” in the list of segmentation categories.
- Set two conditions: Users where Count of Sessions 2 AND where Count of Sessions < 5.
- Click the blue “Save” button.
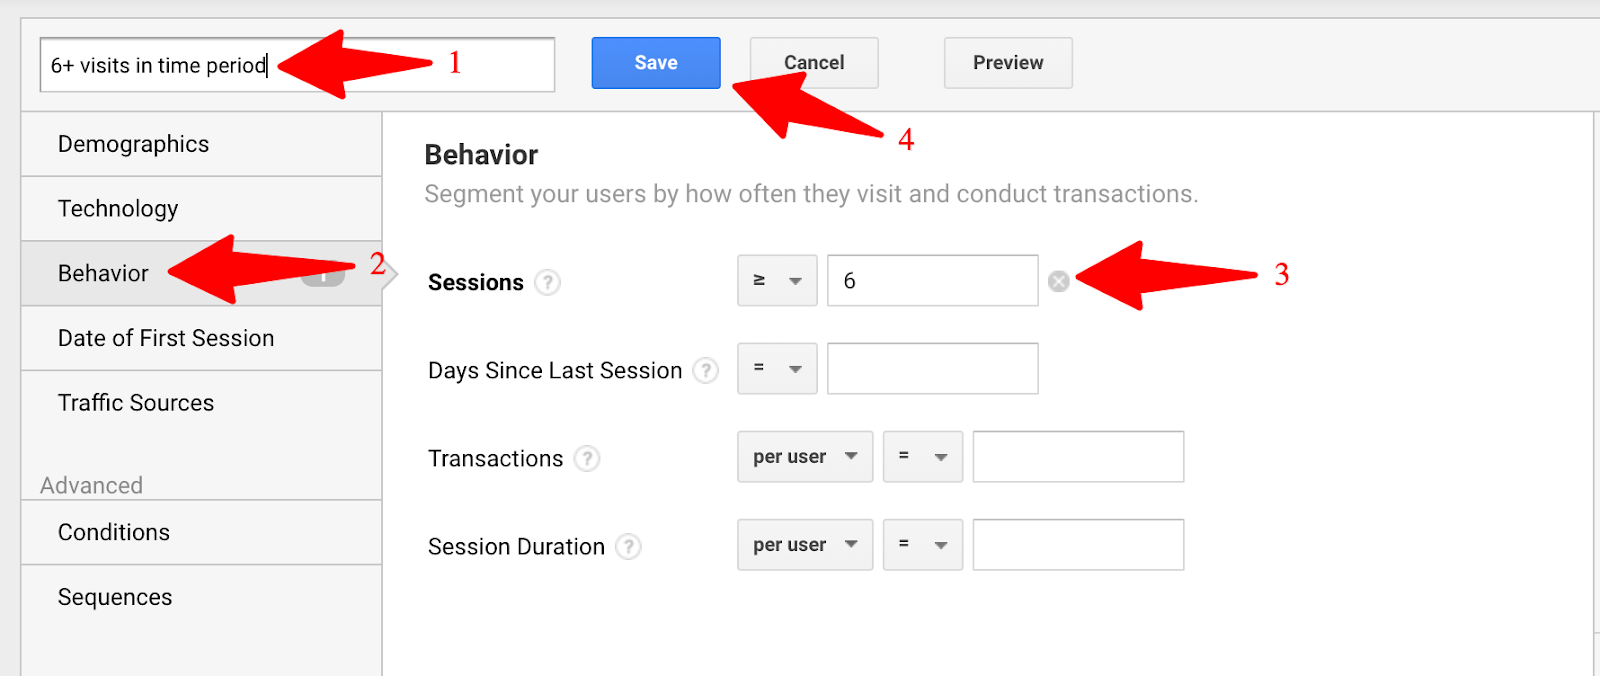
Finally, create your third segment, those visiting 6 or more times in a given time period.
- Give your segment a name; for instance, “6+ visits in time period.”
- Click “Behavior” in the list of segmentation categories.
- Set the number of sessions as > 6
- Click the blue “Save” button.
To view these three audience segments, navigate to Audience > Overview. Then, above the timeline, click on the “+ Add Segment” button. The button text will change to “Choose segment from list.”
- Set your date range to a single month (you can change to a different month any time you want).
- Select your three segments by clicking on the checkboxes next to each.
- Click the blue “Apply” button.

Once you’ve done this, you will be able to see information like this about your three segments:
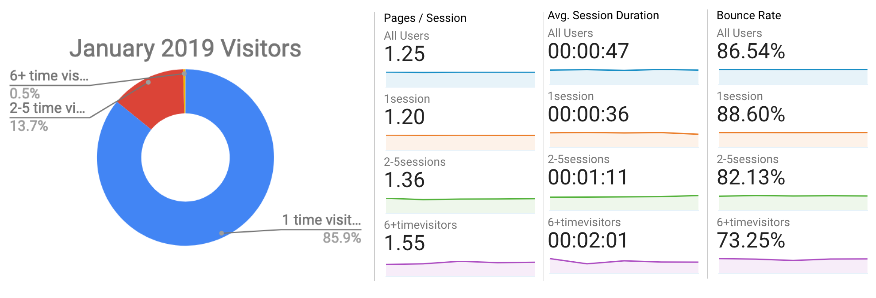
In this example, you can see that 85.9% of users come just once in a month, while 13.7% come 2-5 times and 0.5% come 6 times in a month. You can also see the difference in the levels of engagement for these different segments – based on pages per session, session duration and bounce rate.
Track this information monthly. You should be trying to increase the number of users in the 2-5 sessions per month and 6+ sessions per month categories … and to improve the engagement metrics for those users.